

Home Data Center Transparency Data
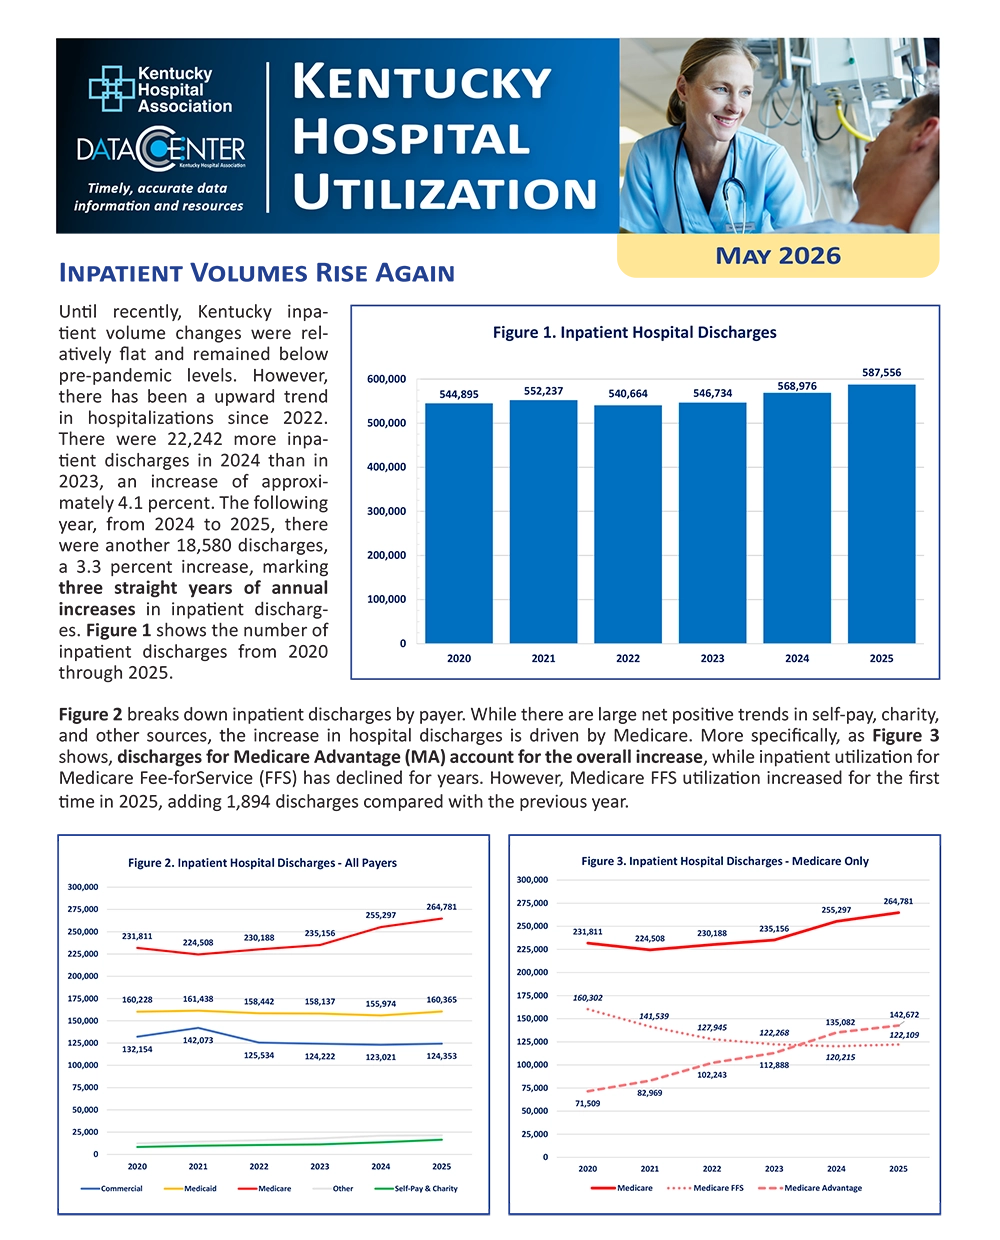
Kentucky Hospital Utilization
An analysis of trends in inpatient visits, outpatient visits, and emergency room utilization at Kentucky hospitals. (2026)
See below for a selection of different data visualizations using KHA InfoSuite Hospitalization.
Click on each chart to view the full-size version.
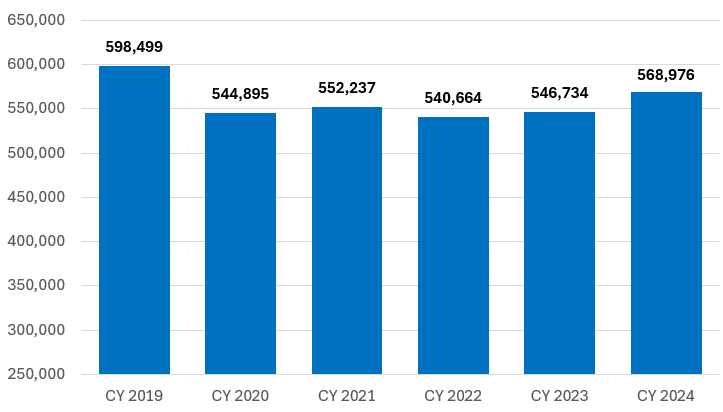
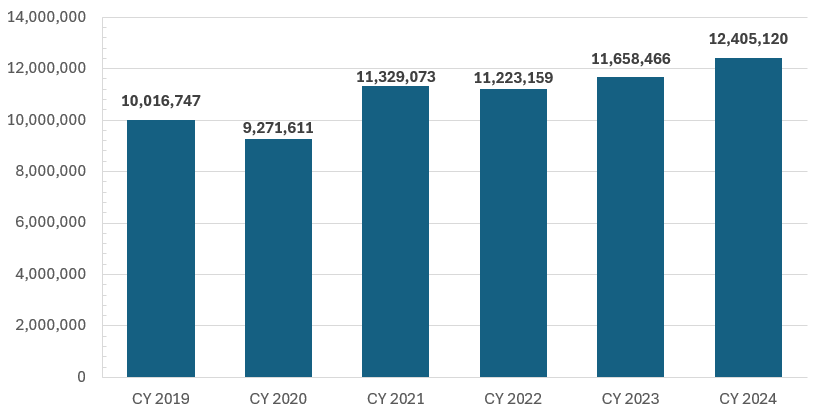
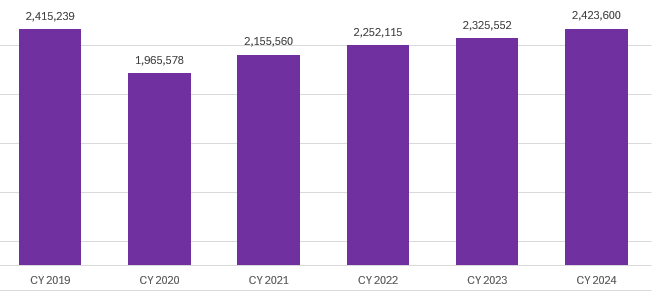
FIGURE 1: Annual Discharges from 2019 – 2024
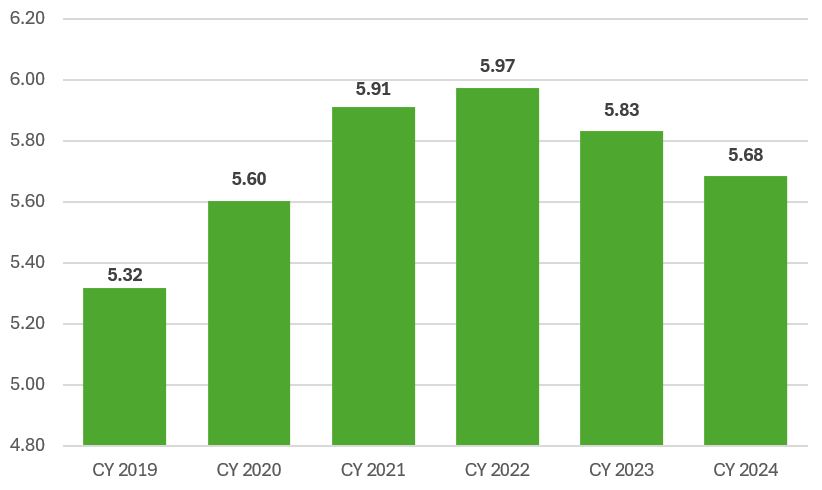
FIGURE 2: Average Length of Stay from 2019 – 2024
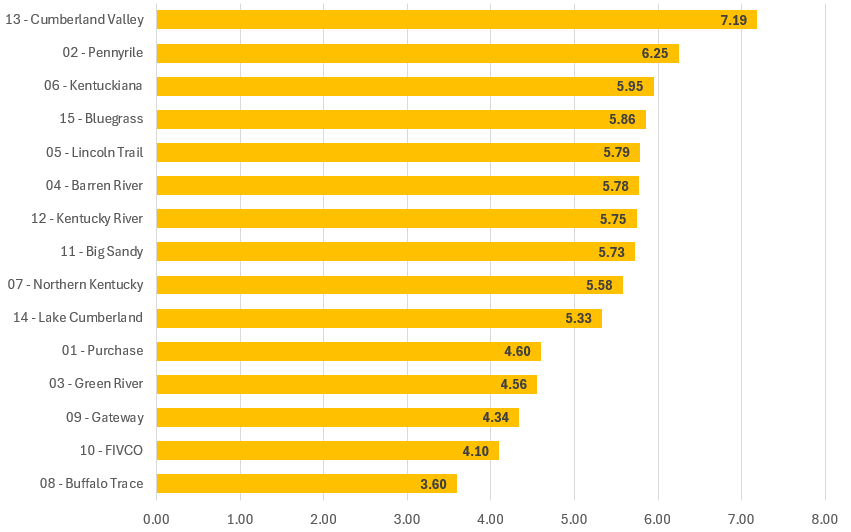
FIGURE 3: Average Length of Stay by Area Development District, 2024
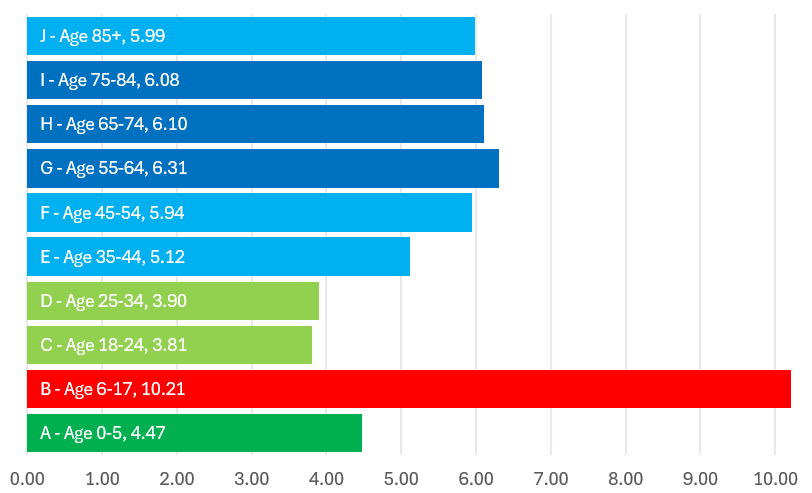
FIGURE 4: Average Length of Stay by Age, 2024
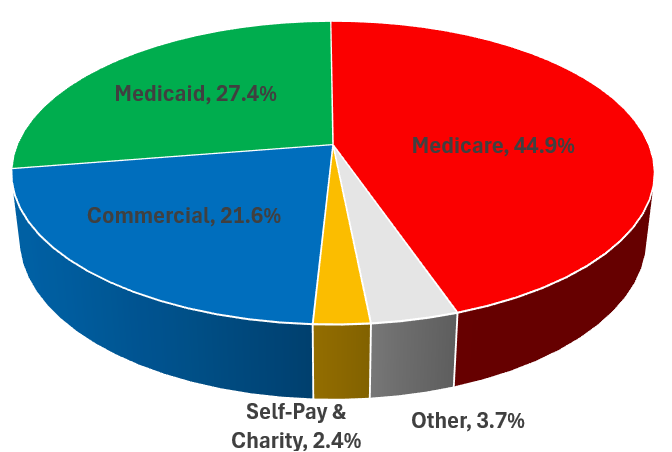
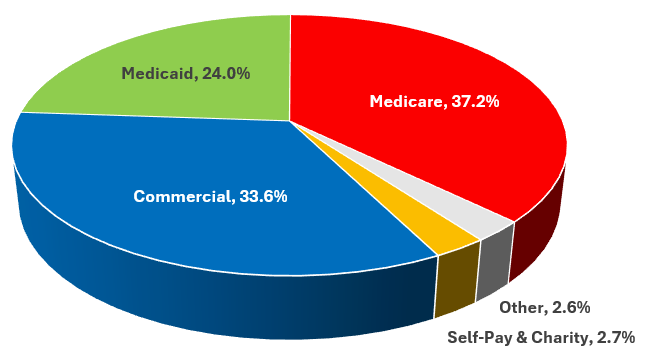
FIGURE 5: Inpatient Discharges by Payer, 2024
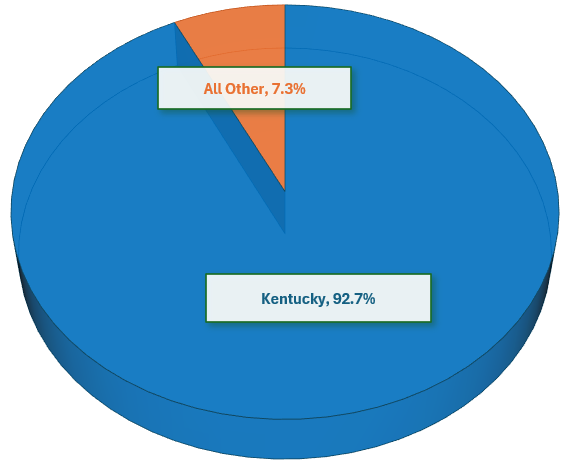
FIGURE 6: Patient Location, 2024
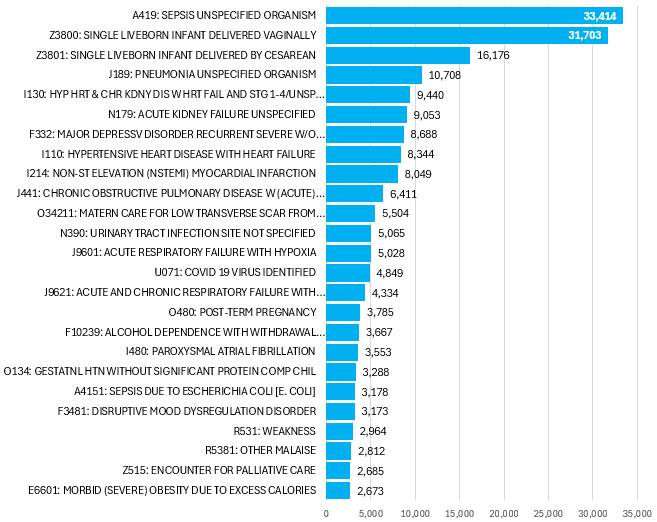
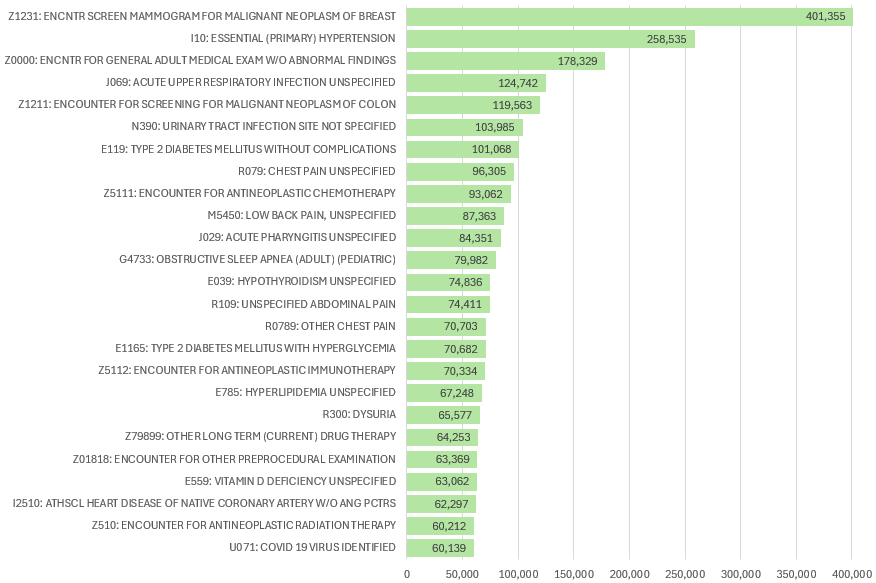
FIGURE 7: Inpatient, Top-25 Principal Diagnosis, 2024
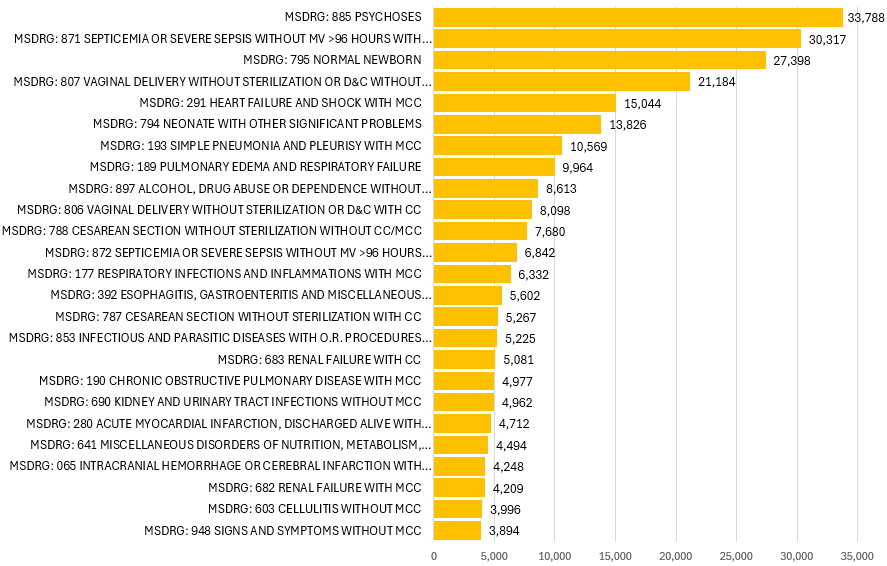
FIGURE 8: Inpatient, Top-25 Diagnosis-Related Groups (DRG), 2024
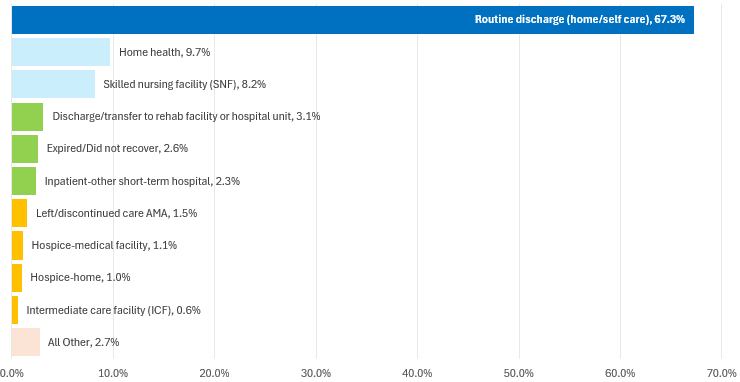
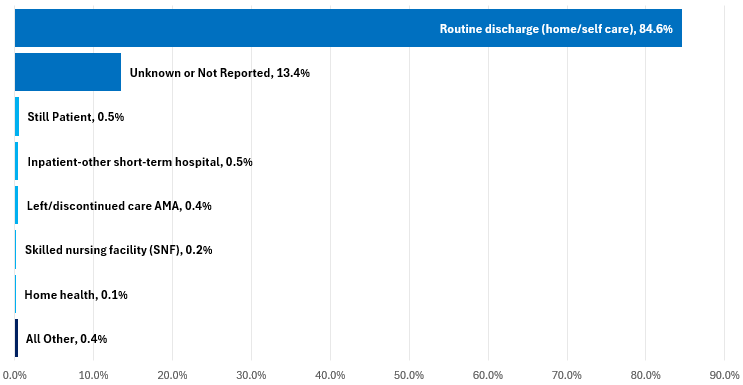
FIGURE 9: Patient Discharge Status, 2024
FIGURE 10: Annual Outpatient Visits from 2019 – 2024
FIGURE 11: Outpatient Visits by Payer, 2024
FIGURE 12: Outpatient Discharge Status, 2024
FIGURE 13: Outpatient, Top-25 Principal Diagnosis, 2024
FIGURE 14: Births Inside the Hospital, 2019 - 2024
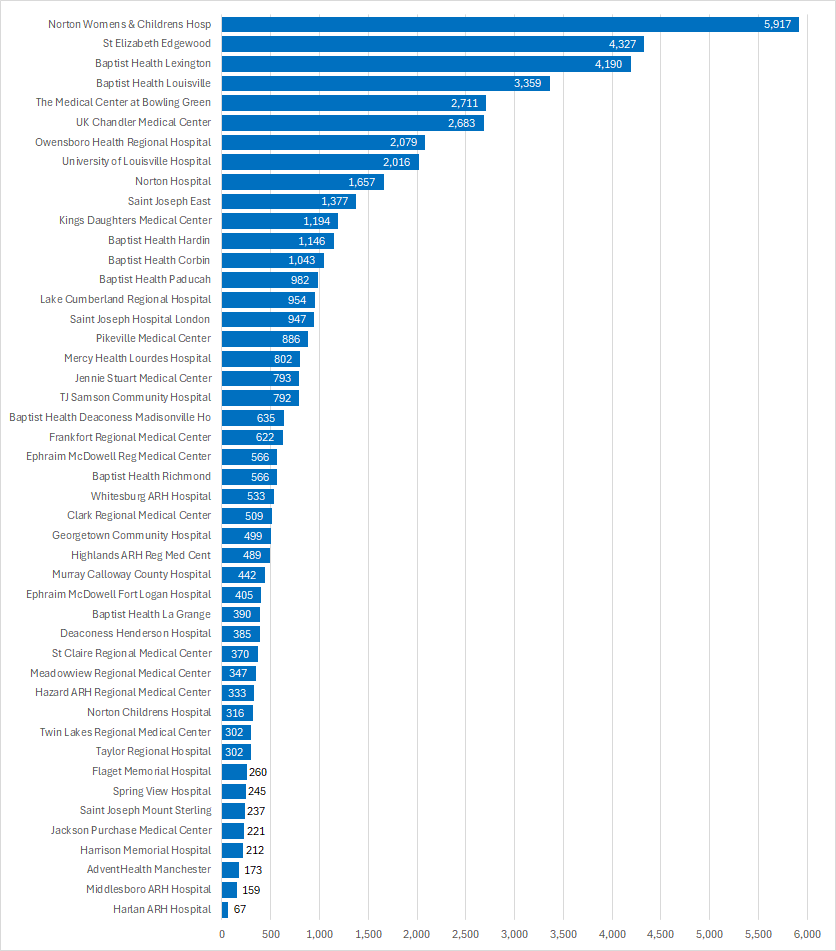
FIGURE 15: Births Inside the Hospital by Hospital Name, 2024
Birthing-Friendly Hospitals and Health Systems
Includes an interactive map showing birthing-friendly hospitals & health systems.
(Centers for Medicare and Medicaid Services)
FIGURE 16: Emergency Room Visits from 2019 – 2024
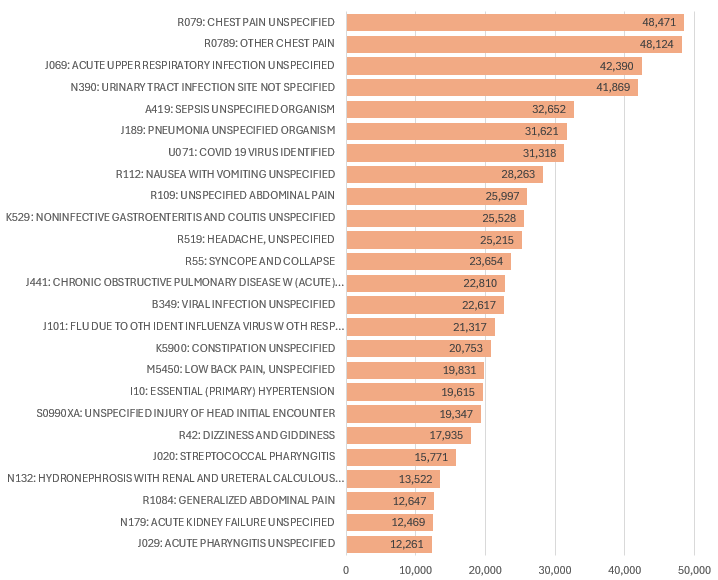
FIGURE 17: Emergency Room, Top-25 Principal Diagnosis, 2024