Home Data Center Transparency Data Public Reports Kentucky Hospital Utilization
May 2026
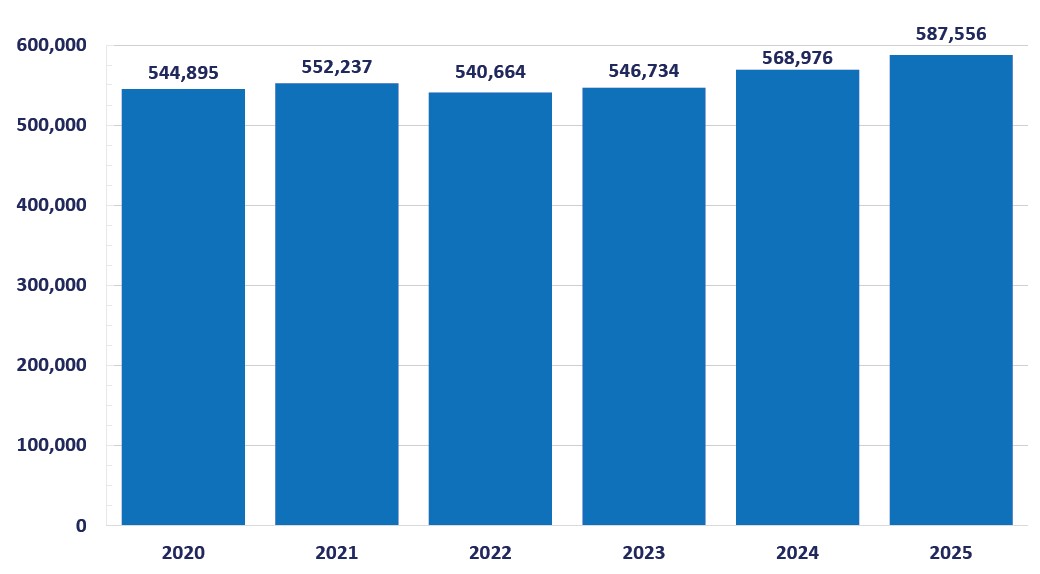
Inpatient Volumes Rise Again
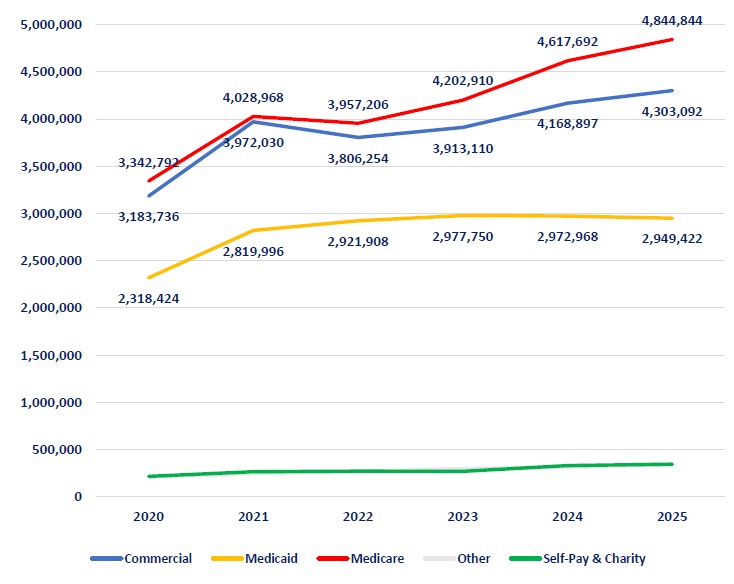
Until recently, Kentucky inpatient volume changes were relatively flat and remained below pre-pandemic levels. However, there has been a upward trend in hospitalizations since 2022. There were 22,242 more inpatient discharges in 2024 than in 2023, an increase of approximately 4.1 percent. The following year, from 2024 to 2025, there were another 18,580 discharges, a 3.3 percent increase, marking three straight years of annual increases in inpatient discharges. Figure 1 shows the number of inpatient discharges from 2020 through 2025.
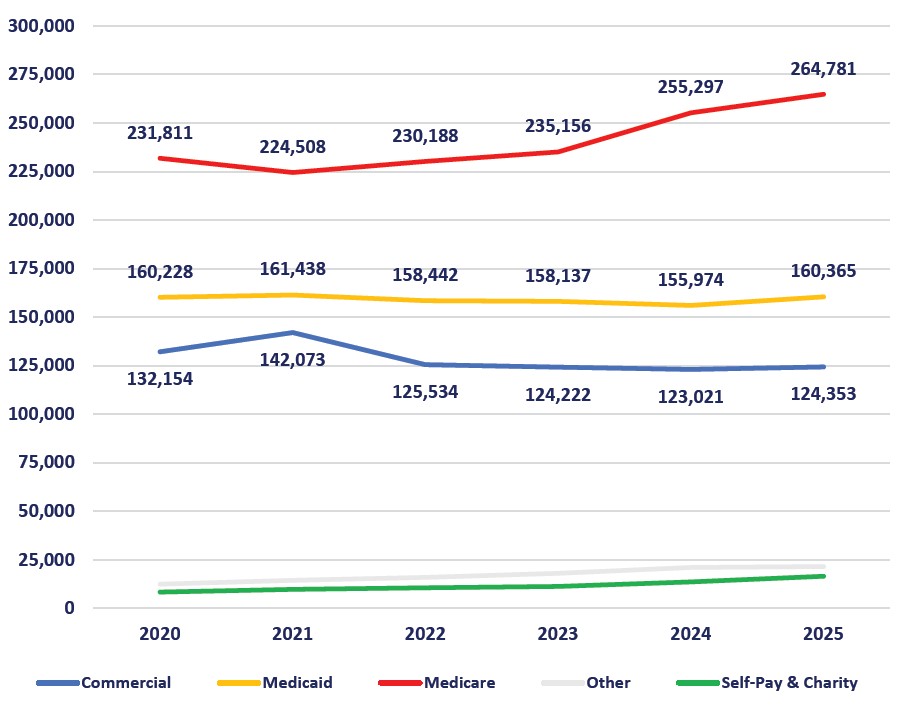
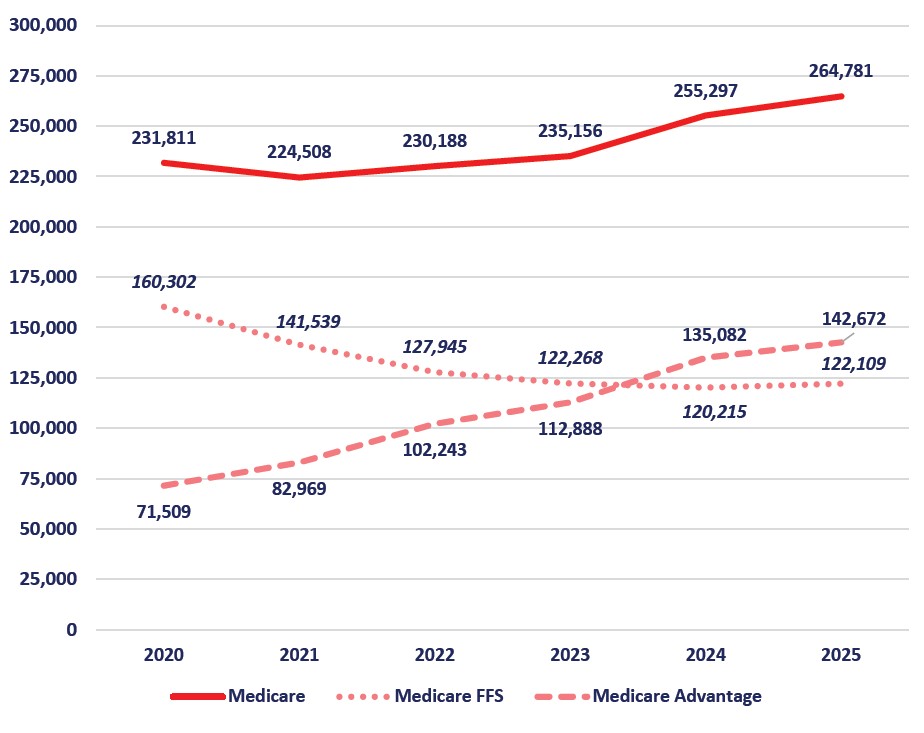
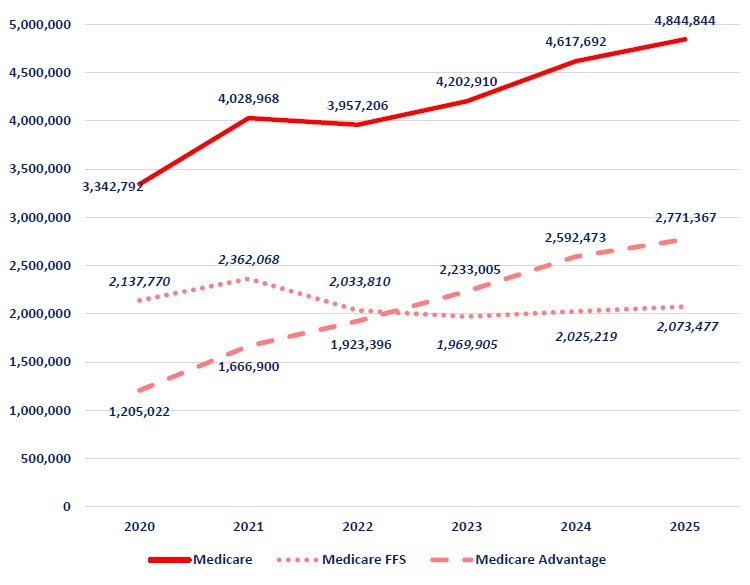
Figure 2 breaks down inpatient discharges by payer. While there are large net positive trends in self-pay, charity, and other sources, the increase in hospital discharges is driven by Medicare. More specifically, as Figure 3 shows, discharges for Medicare Advantage (MA) account for the overall increase, while inpatient utilization for Medicare Fee-forService (FFS) has declined for years. However, Medicare FFS utilization increased for the first time in 2025, adding 1,894 discharges compared with the previous year.
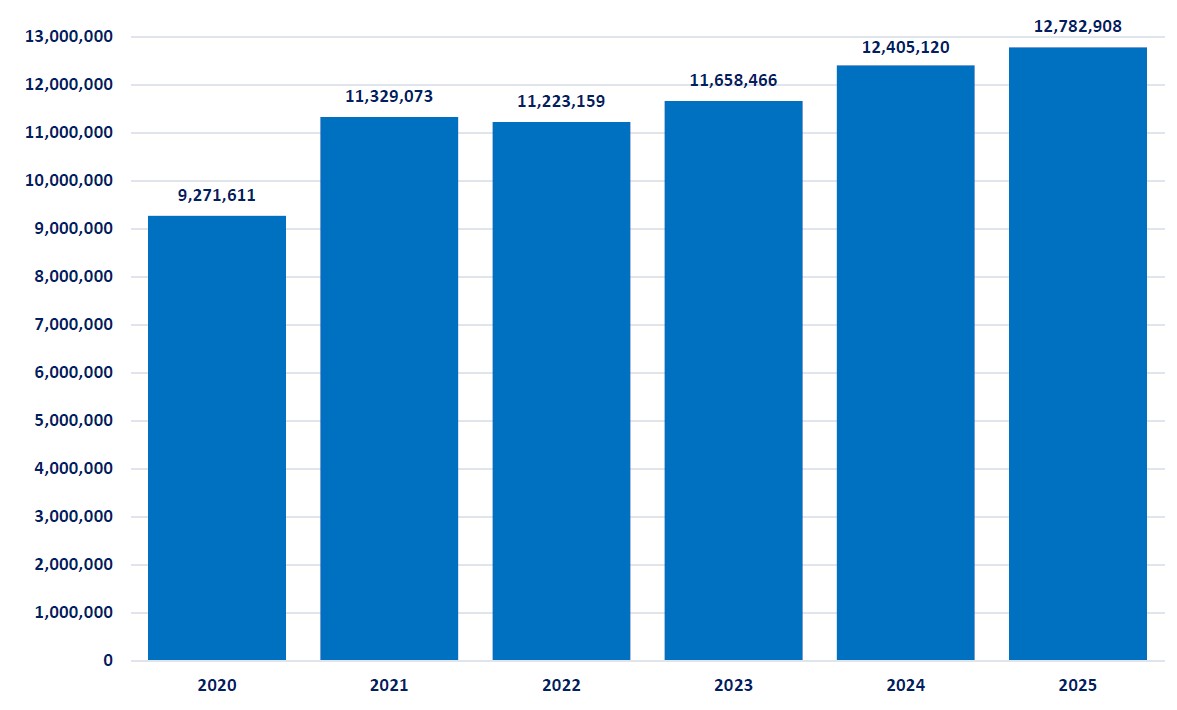
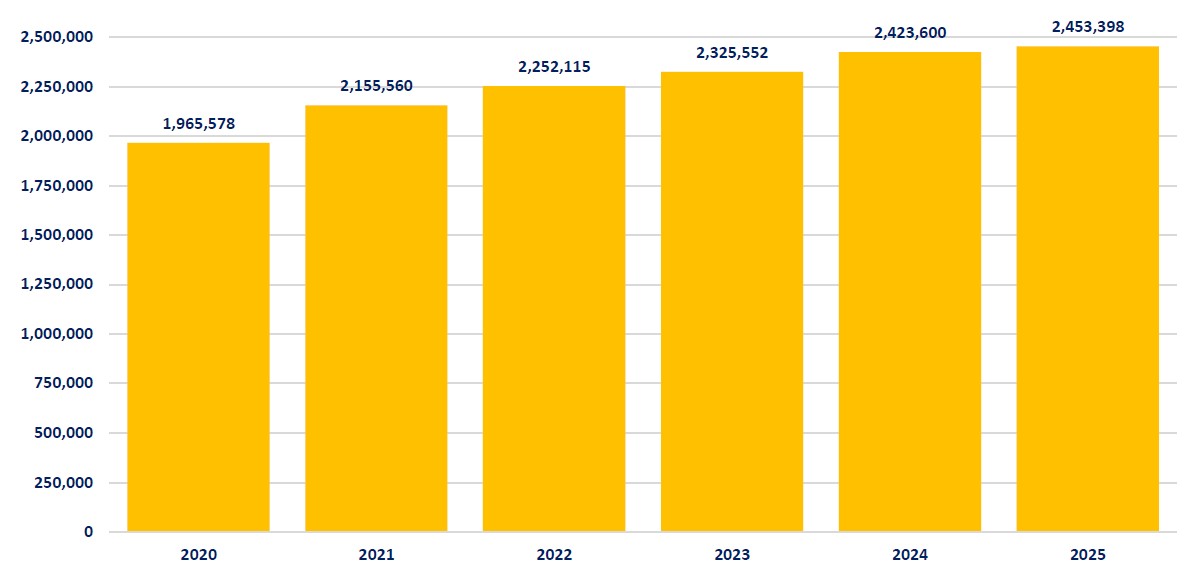
Outpatient Visits Continue to Increase, Exceeding 12.7 Million per Year
In contrast, the number of outpatient visits has increased for many years, only slowing during the pandemic, and has grown by over 1.5 million visits since 2022. The total number of outpatient visits now exceeds 12.7 million per year and is likely to grow (See Figure 4).
Figure 4. Outpatient Hospital Visits
Outpatient visits have increased
by over 1.5 million visits since 2022.
Similar to inpatient utilization, Medicare plays an outsized role in the growth of outpatient visits. However, in addition to Medicare, the commercial payers also play a significant role, while Medicaid utilization is flat or declining. MA is again driving this increase in utilization, at nearly twice the rate of commercial payers, while Medicare FFS outpatient utilization remains flat. MA surpassed traditional Medicare FFS utilization in 2023 (see Figures 5 and 6).
Emergency Department Utilization Now Exceeds Pre-Pandemic Levels
Emergency department (ED) utilization is alternatively coded as inpatient or outpatient and, therefore, included in the discharges (inpatient) and visits (outpatient) above. ED utilization exceeded pre-pandemic levels for the first time in 2024 and continued to grow in 2025, albeit more slowly, with annual increases of 1.2 to 4.5 percent since 2022 (See Figure 7).
Figure 7. Emergency Department Visits
ED utilization exceeded pre-pandemic levels for the first time in 2024.
Figure 8. Outpatient Emergency Department High Acuity, 2022-2025
Changes in Complexity for Inpatient Hospitalizations
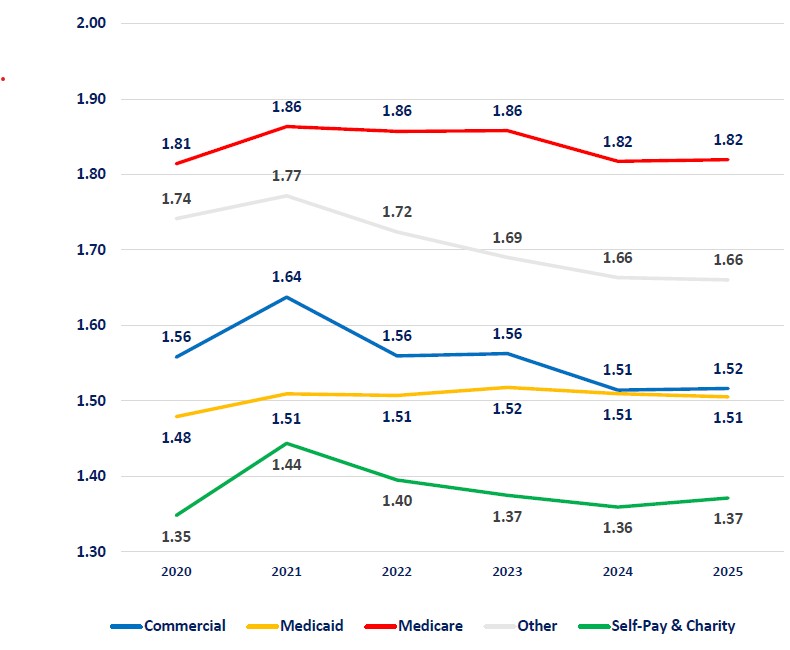
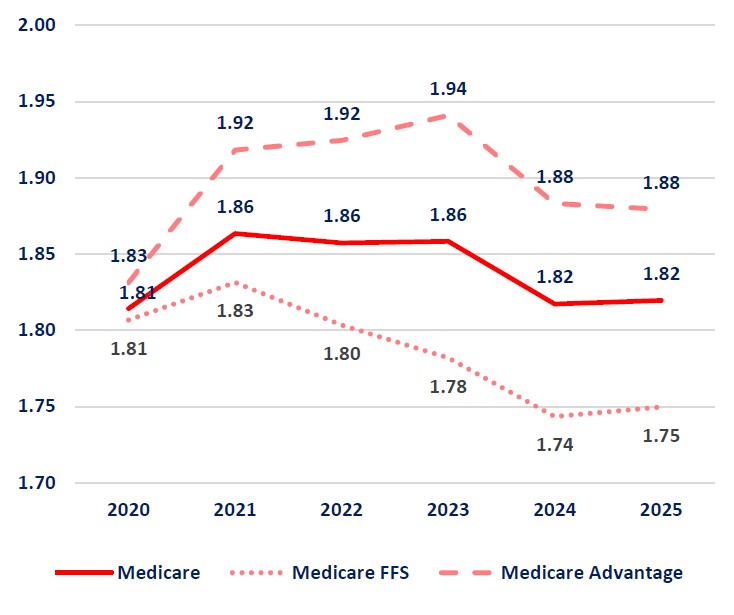
Another measure of complexity is the Case Mix Index (CMI). Figure 9 shows the inpatient CMI by payer from 2020 to 2025. While there is some variation, the average CMI is relatively stable, peaking in 2021 and declining in subsequent years. The largest decline in patient complexity over this span is for discharges for commercial payers, an approximate decrease of 7 percent, from 1.64 to 1.52. Overall, the CMI for Medicare patients shows a modest reduction, from 1.86 to 1.82, but Figure 10 shows a clear distinction between more complex MA discharges and traditional Medicare FFS. As MA discharges continue to increase every year, this trend will impact hospitals. MA plan patients are much more clinically complex, with a CMI of 1.88 compared to 1.75 among Medicare FFS beneficiaries.
Figure 9. Inpatient Case Mix Index (CMI) -All Payers
Figure 10. Inpatient Case Mix Index (CMI) -Medicare Only
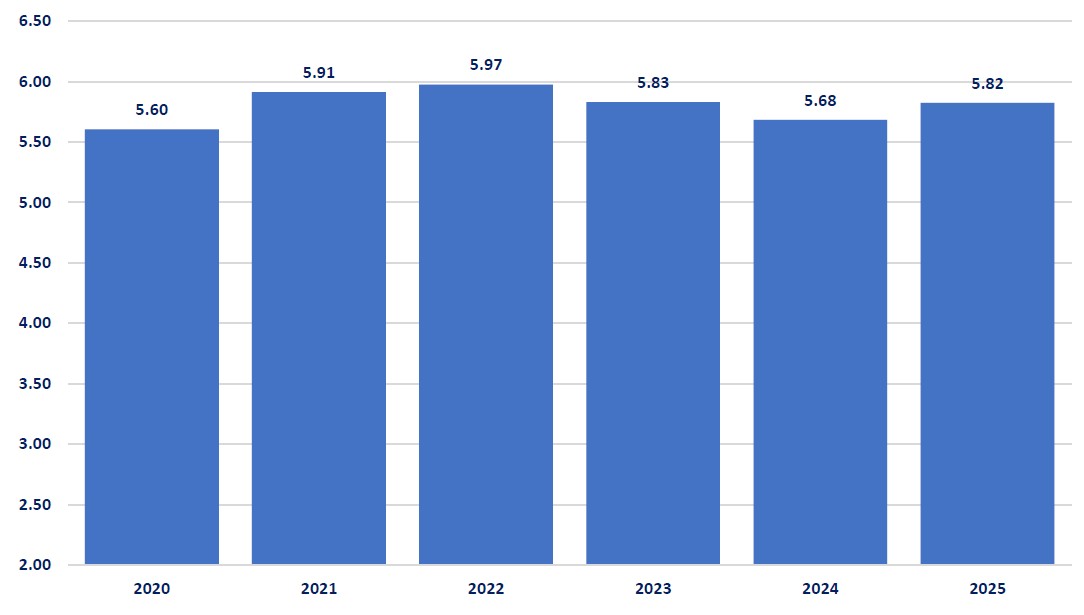
The continued growth in outpatient care is reflected in the average length of stay (ALOS) for inpatient discharges. ALOS increased for several years, reached its peak in 2022, declined in 2023 and 2024, and now resumes its upward trend (see Figure 11). The shift in inpatient volume to MA and the program’s high patient complexity will likely impact ALOS for the foreseeable future.
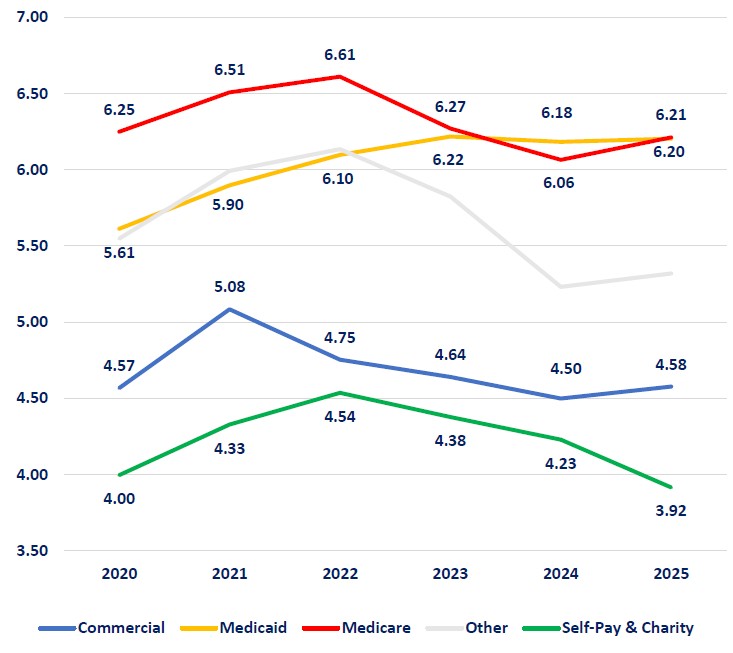
Figure 12 shows inpatient ALOS by payer. Commercial and Medicare ALOS have declined from their respective peaks in 2021 (Commercial, 5.08) and 2022 (Medicare, 6.61), while Medicaid ALOS has increased nearly every year since 2020 and plateaued in 2024 (6.06).
Figure 12. Inpatient ALOS -All Payers
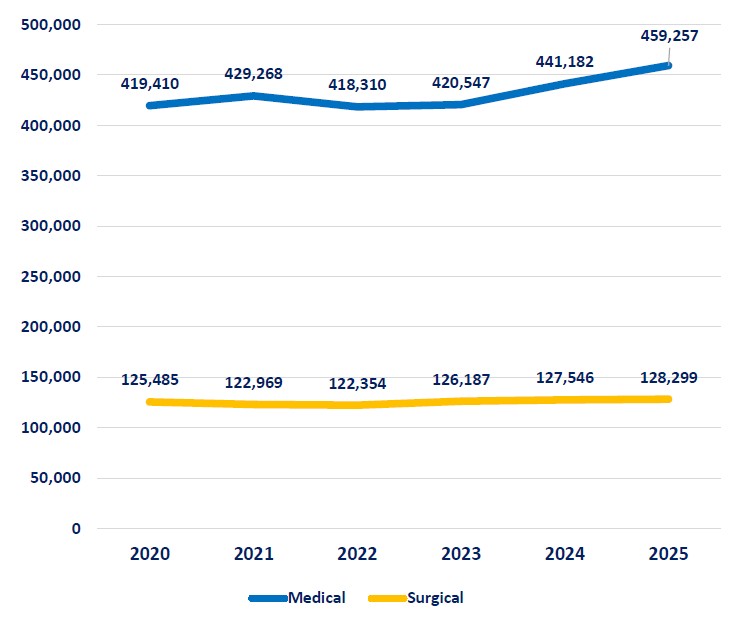
Figure 13. Inpatient Medical & Surgical Discharges
Every year, KHA updates its classification of medical and surgical cases. Figure 13 shows inpatient discharges by type. There is very little variation in type—approximately 22 to 23 percent of all discharges are surgical cases—although there is a net increase in discharges. While the number of surgical discharges is relatively stable at approximately 125,000 per year, Kentucky hospitals treat more medical cases than ever before.
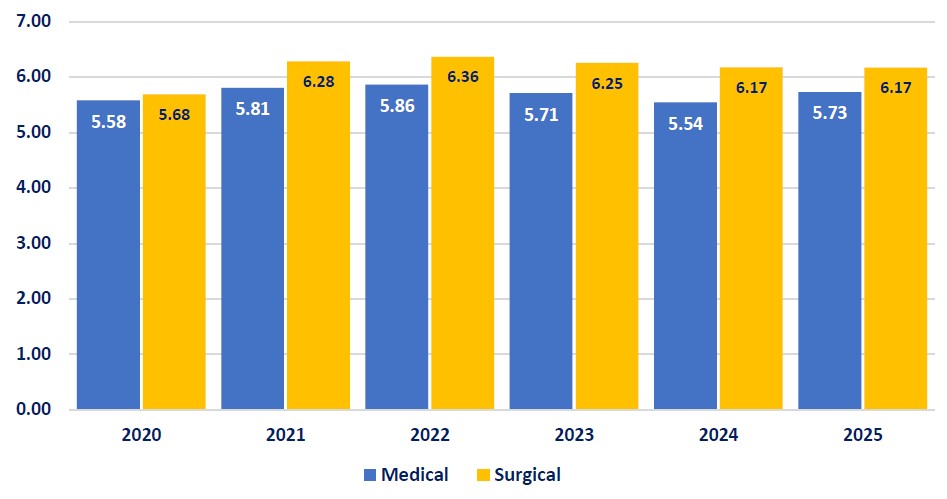
As noted above, the recent decline and subsequent increase in ALOS can also be seen for medical and surgical cases. While surgical cases remain longer than medical cases, the gap began to widen. Initially, the ALOS for both types was similar, but over the ensuing years, the ALOS for surgical cases increased, and by 2024, it was 11 percent longer than for medical cases (See Figure 14). However, in 2025, the difference in ALOS was less than half a day (0.44 days).
Figure 14. Inpatient Medical & Surgical ALOS
Maik Schutze
Director, Health Information & Analytics
Kentucky Hospital Association
502-992-4316