Home Data Center Transparency Data Kentucky Medicaid by the Numbers
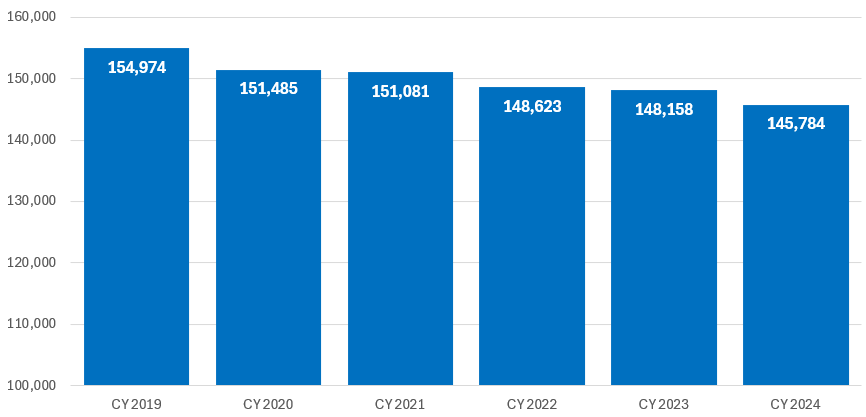
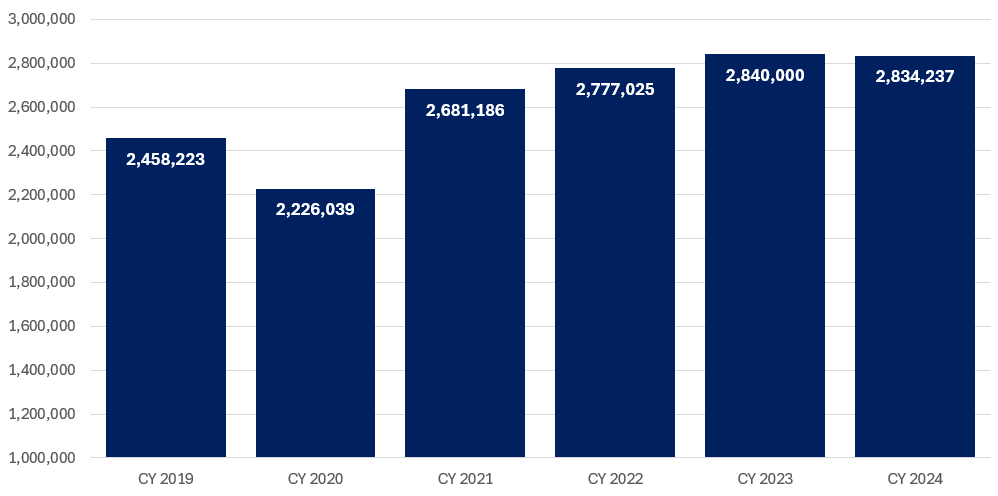
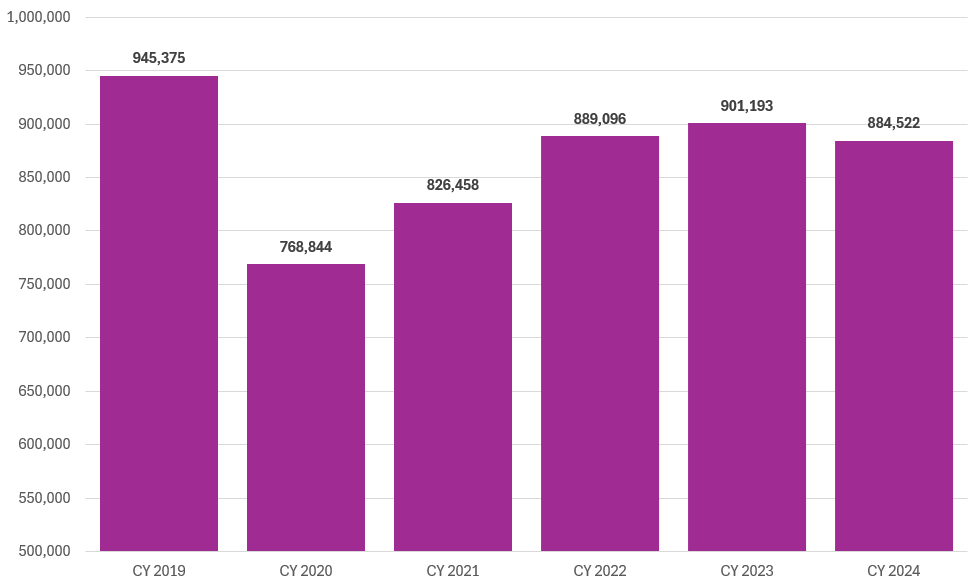
FIGURE 1: Number of Inpatient Discharges, Kentucky Medicaid, CY 2019 - 2024
Note: Out-of-state Medicaid beneficiaries are excluded and typically represent between 8,000 and 10,000 inpatient discharges per year.
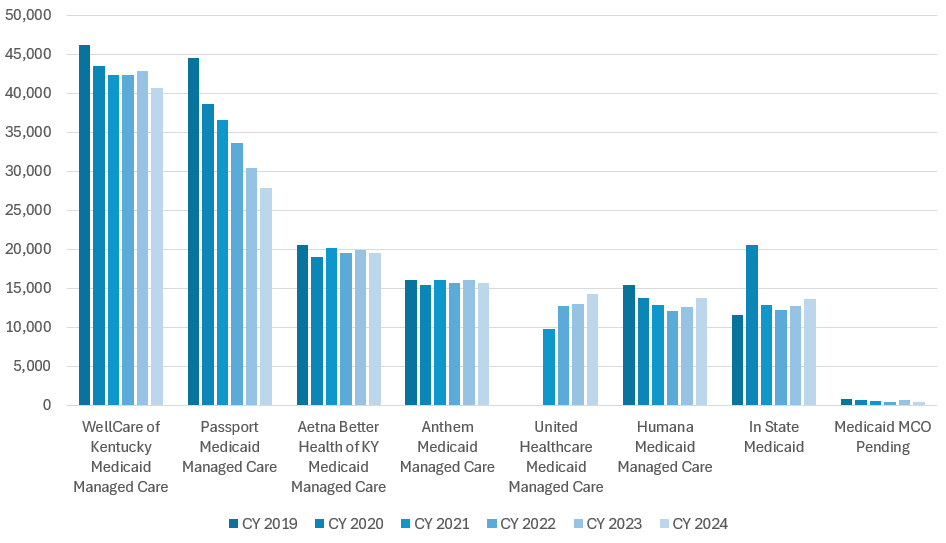
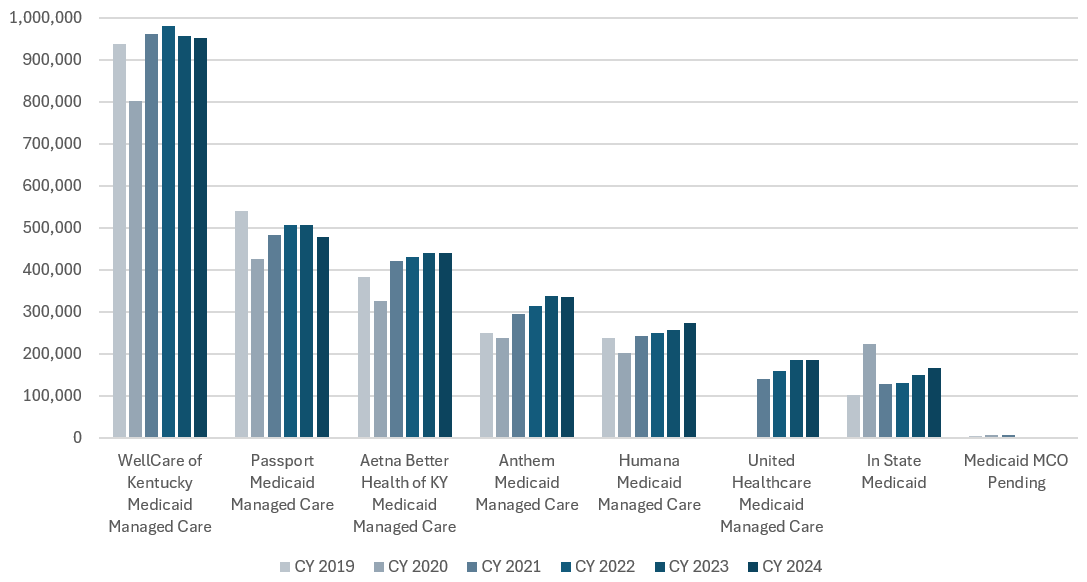
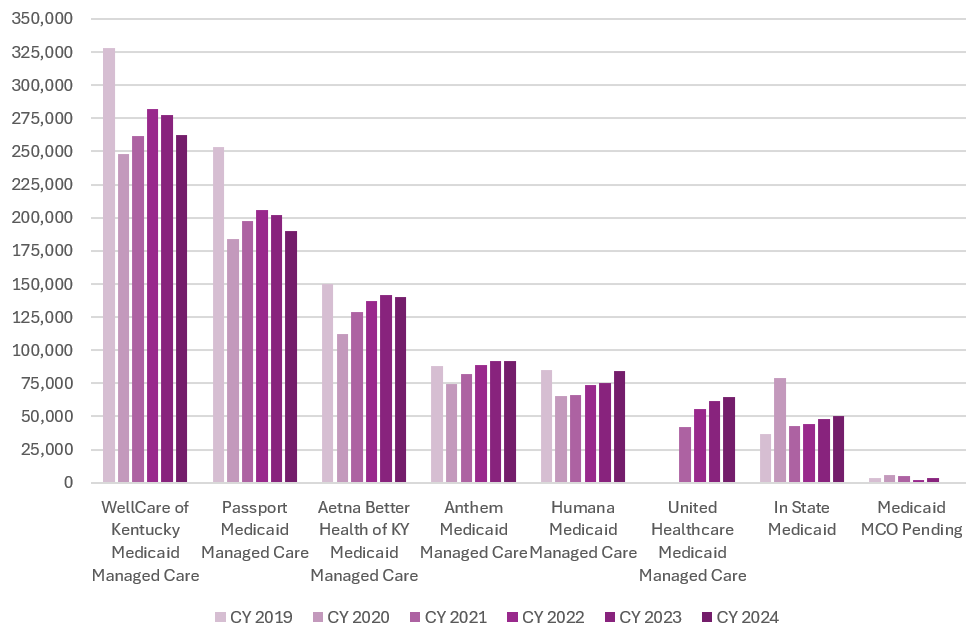
FIGURE 2: Number of Inpatient Discharges, Kentucky Medicaid FFS and MCO, CY 2019 - 2024
W/O: "Out of State Medicaid"
Note: Out-of-state Medicaid beneficiaries are excluded and typically represent between 8,000 and 10,000 inpatient discharges per year.
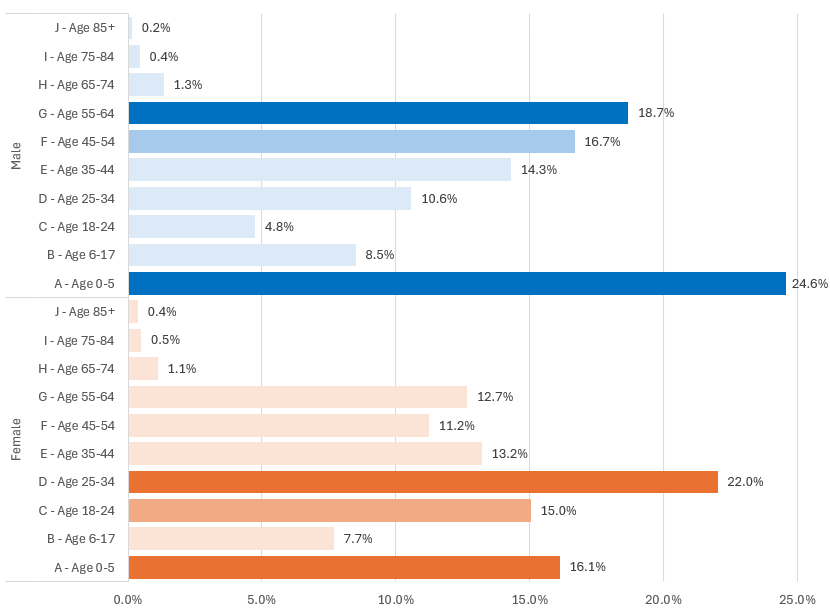
FIGURE 3: Inpatient Discharges, Kentucky Medicaid, by Gender and Age Group, CY 2024
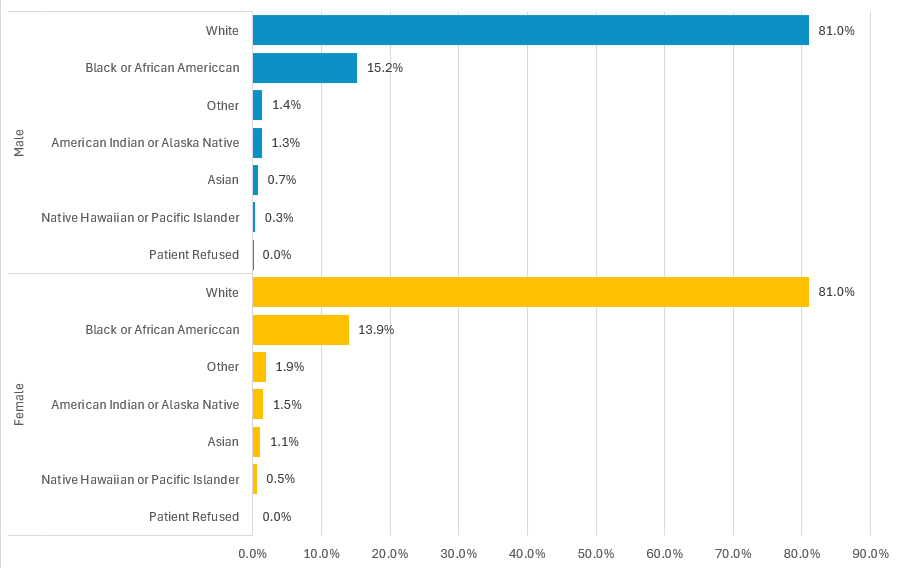
FIGURE 4: Inpatient Discharges, Kentucky Medicaid, by Gender and Race, CY 2024
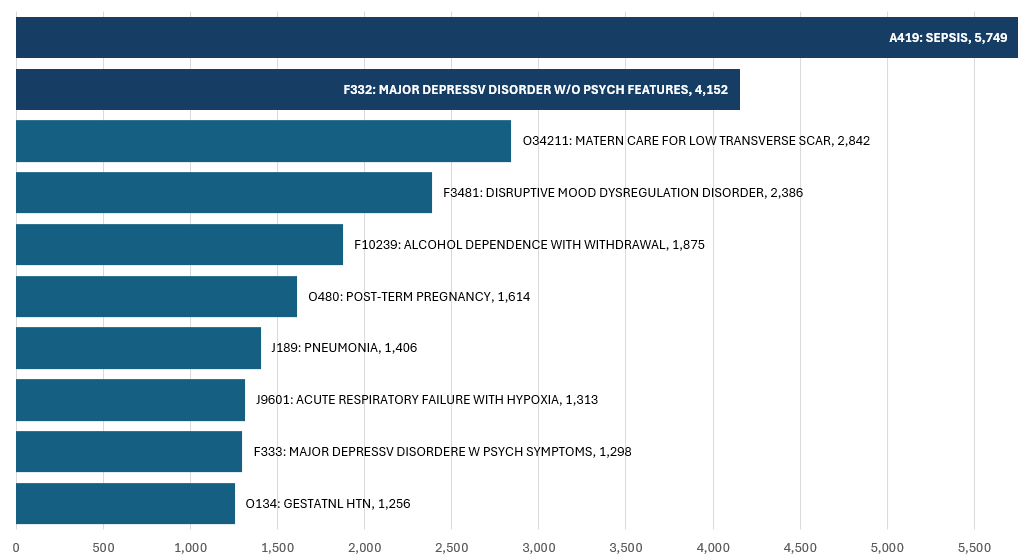
FIGURE 5: Top-10 Principal Diagnoses for Inpatient Discharges, Kentucky Medicaid, CY 2024
Note: Single live births are the most frequent reasons for an inpatient discharge and typically account for 22,000 - 26,000 inpatient discharges per year.
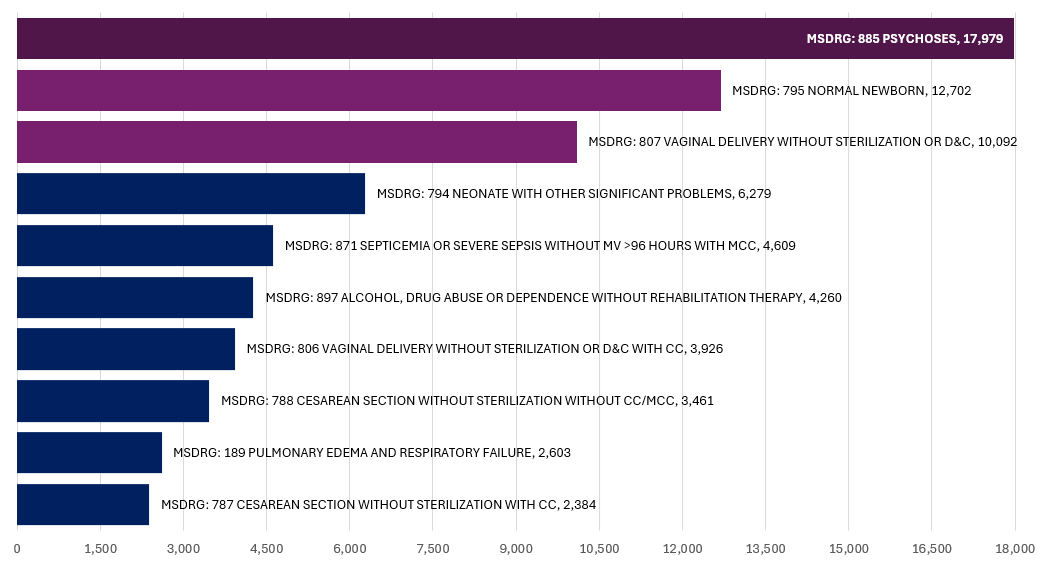
FIGURE 6: Top-10 Diagnostic Related Groups (DRG) for Inpatient Discharges, Kentucky Medicaid, CY 2024
FIGURE 7: Number of Outpatient Visits, Kentucky Medicaid, CY 2019 - 2024
W/O: "Out of State Medicaid"
FIGURE 8: Number of Outpatient Visits, Kentucky Medicaid FFS and MCO, CY 2019 - 2024
W/O: "Out of State Medicaid"
FIGURE 9: Emergency Room Visits, Kentucky Medicaid, CY 2019 - 2024
FIGURE 10: Emergency Room Visits, Kentucky Medicaid FFS and MCO, CY 2019 - 2024